
By Jerry Rothstein
What do we know about our city, our neighborhood, our street, not to mention the wider world of the great state of Minnesota? What is important, really necessary, nice to know but not essential?
Usually we start with an overall awareness of the larger world — something about the state, the city, taxes, schools, arts and cultural resources, services we might need. We learn the practicalities of meeting our needs.
When we want to have a broader perspective to help make family decisions; plan for the development of our business or profession; determine what social services our community will need and what agencies are best to develop and operate them — we need to have access to credible and complete information that can illuminate where we have been and how things are trending across many key categories of societal life.
The Minnesota Compass Project was developed precisely to help us address such questions. When leaders from around the state voiced a desire to have credible, easy-to-access data about what was happening in their communities across Minnesota, Wilder Research worked with advisors representing business, government, nonprofit, and philanthropy to develop and implement Minnesota Compass as a statewide resource for reliable data.
Minnesota Compass is a social indicators project that measures progress in our state and its communities. Led by Wilder Research, Minnesota Compass provides nonpartisan information and tracks trends in topic areas such as education, economy, workforce, health, housing, and many others.
Data and analysis on mncompass.org give everyone in our state — policymakers, business and community leaders, and concerned individuals who live and work here — a common foundation to identify, understand, and act on issues that affect our communities. Compass does this by:
• Providing unbiased, credible information.
• Tracking trends and measuring progress on issues that impact our quality of life.
• Identifying disparities by race, age, gender, and income as data are available.
• Providing additional resources for addressing issues.
Not only does MN Compass provide this wealth of material, it also allows anyone to use the tools they have developed to create individual research results. See mncompass.org and go to the Build Your Own section on the home page. You’ll be able to create a custom profile for your area of interest anywhere in the state. Instructions and tutorials guide you through the process.
When you use the MN Compass resources you can find measurable information that shows trends over time on select areas related to quality of life across the state and in our local communities. The information is provided in a wide variety of topic areas, many of which have important links to other topics when using the data for planning and development purposes, or to assess how a given community is doing in essential areas.
The topic areas, each of which has a link to results on the MN Compass site, include: Aging, Arts and Culture, Children and Youth, Civic Engagement, Demographics, Disparities, Early Childhood, Economy, Education, Environment, Health, Housing, Immigration, Public Safety, Transportation and Workforce. Special topics are added periodically; currently data around STEM and Risk, Reach and Resilience, and the recently launched Cultural Community Profiles are offered. Community advisory committees guided the selection of data indicators included in each topic area.
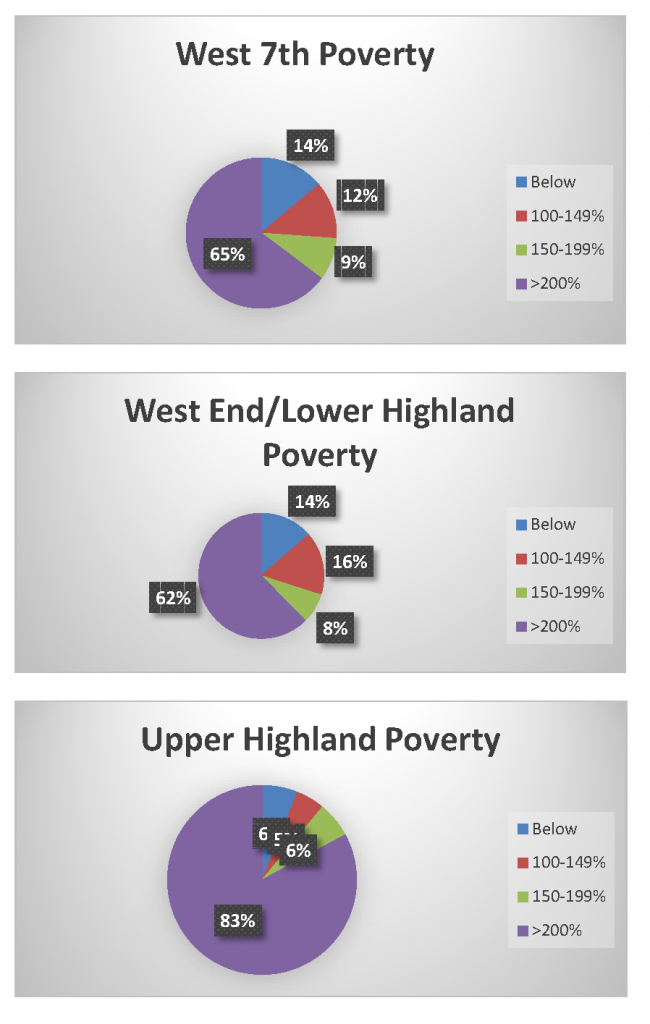
By using the Build Your Own tools, you can create in-depth data profiles or build your own data profile for Minnesota communities by geographic area. For a sample analysis of poverty levels in the West End and Highland districts see www.communityreporter.org.
The West End of St. Paul is historically and culturally consistent from downtown to the Highway 5 bridge. But political divisions paint a different picture. Part of City Council District 2 (C.M. Noecker and the West 7th/Fort Road Federation) takes more than half of the West End, with a boundary around Montreal and West Seventh. Part of City Council District 3 (C.M. Tolbert and the Highland District Council) covers the western part of the West End and the Highland district. By selecting the boundaries carefully with the MN Compass Build Your Own tool, we’re able to confirm that using the variable of poverty levels, both parts of the West End are consistent, while the rest of Highland is quite different. This could be a starting point for many investigations — whether housing costs are affordable; whether public transit options are equitable for lower-income people.
MN Compass also offers us interpretation and analysis, using data to illuminate trends and major issues. Recent offerings (all available on the website) have included “No car and too far: Transportation solutions for vulnerable populations in greater Minnesota;” “Manufacturing in Minnesota: four things to know;” “Three questions about internet access in greater Minnesota answered;” “Minnesota is growing. How are we growing and by how much?;” “Minnesota’s workforce shortage.”
Important trends are identified and discussed. A “Notable increase in adult obesity” shows a slow but significant growth in overweight adults in Minnesota, tracked over an eight-year period. “Updated indicators of early childhood development in Minnesota” reports on the 2018 Minnesota Early Childhood Risk, Reach, and Resilience project, allowing us to explore county-level data on 12 economic, family stability, and health measures of risks to the well-being of young children, and coverage of 11 publicly funded programs serving the early learning, health, and basic needs of young children. A new Racial Equity Resource Directory provides a statewide listing of racial equity programs and training providers serving faith communities, civic organizations, educational institutions, and anyone working to combat racism and increase cultural competence. See mncompass.org/disparities/resource-directory.
“Minnesota’s Cultural Communities At-a-Glance” gives us information about the rich mixture of race, ancestry, birthplace, and parental characteristics that comprise our Minnesota community, including residents who have come from Mexican, Hmong, Somali, Asian Indian, Chinese, Vietnamese, Korean, Ethiopian, Filipino, Lao, Liberian, and Puerto Rican cultural communities. With clearer information on cultural identification, we can better understand the composition of people who make Minnesota their home and the different contributions they make to our state’s workforce, economy, and social fabric.
Minnesota Compass is one of the premier resources for understanding and acting on the issues in society today. Explore the possibilities at mncompass.org.


Leave a Reply